--
This is an overview of how my team and I designed and built an automatic dart scoring system. This project was our final project for the class Computer Vision. I took the class as part of my studies at Reykjavik University in fall 2023.
Abstract
This paper presents PEELA (Precision Enhanced Electronic Dart Scoring System), a dart scoring system developed to address the limitations of the DeepDarts model, particularly in multi-keypoint detection from various angles. PEELA integrates a dual-camera setup with the YOLOv4 object detection algorithm to accurately and reliably detect darts by overcoming the challenges of occlusion and angle-related inaccuracies inherent in single-camera systems. The system's efficiency is powered by the inclusion of YOLOv4, known for its effectiveness in real-time object detection. PEELA offers a scoring system suitable for both casual and professional settings, and can be integrated with user-friendly frontend interfaces for real-time score displays and interactive experiences. This paper details PEELA's methodology, implementation, and performance evaluation, highlighting its potential to revolutionize dart scoring and build on the foundational work of DeepDarts.
Video demonstration of the PEELA project can be viewed at: https://youtu.be/xSgcSfliEc0
The updated frontend can be found at: https://github.com/SindriTh/darts-go
The project repository can be found at: https://github.com/olistarri/dart-stuff
Introduction
Advancements in computer vision and object detection technologies have paved the way for sophisticated systems capable of executing complex tasks with remarkable precision. This paper introduces PEELA (Precision Enhanced Electronic Dart Scoring System), which extends the DeepDarts dataset's capabilities. The DeepDarts system, as described in the seminal paper by Wood, represents a significant leap in automatic scorekeeping for steel-tip darts using a single-camera approach. However, it acknowledged certain limitations, particularly in multi-keypoint detection from various angles, motivating further advancements in this field.
Prior implementations of dart detection have primarily focused on utilizing feature mapping techniques for line detection. This approach involves identifying and mapping various lines present in the image, which are critical for understanding the spatial arrangement within the dartboard area. These detected lines serve as a fundamental component in the dart detection process.
PEELA addresses the limitations of traditional scoring systems by integrating a dual-camera setup and employing the YOLOv4 object detection algorithm. By comparing frames from two cameras, PEELA significantly enhances the accuracy and reliability of dart detection, overcoming the challenges of occlusion and angle-related inaccuracies inherent in single-camera systems.
Materials and Methods
Hardware
The project utilized the INTEL NUC7i5BNK, a compact computing unit, for connecting two ELP cameras. This device was chosen for its compact form factor and sufficient processing capabilities. Additionally, a custom-built high-performance computer, comprising an Intel 7940X processor, RTX TITAN graphics card, and 128GB RAM, was deployed for training the deep learning models. The substantial computational resources of this system were necessary to handle the intensive processing requirements.
For image capturing, the ELP 170 Degree Wide Angle Fisheye Web Camera 5.0 Megapixel (ELP-USB500W05G-BL170) was employed. These cameras are equipped with an Aptina MI5100 CMOS Sensor and offer a wide fisheye view, which is crucial for capturing detailed and wide-angled images of the dartboard area from close range.
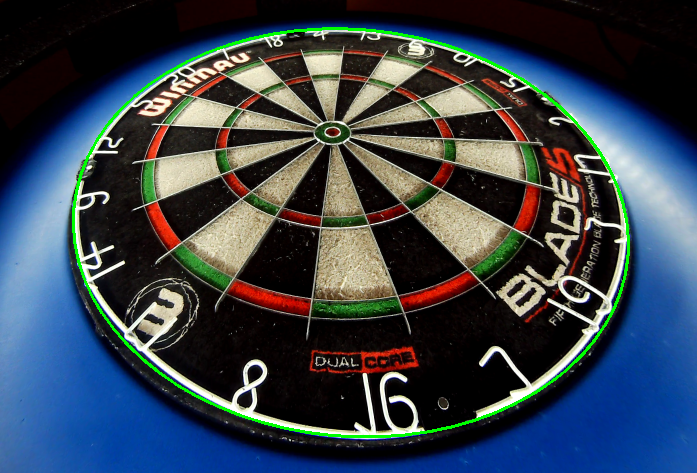
The lighting conditions and dartboard setup were also critical components. The Bull’s Termote 3.0 Light Ring was placed around the dartboard to ensure consistent lighting, essential for high-quality image capture. The Winmau Blade 5 Dartboard, known for its quality and widespread use in professional settings, was the dartboard of choice for the experiments.
Lastly, the stability and positioning of the cameras were managed using custom 3D-printed camera mounts. These mounts were specifically designed and produced to secure the cameras to the ring light, ensuring that they were stably positioned and aligned with the dartboard.
Software
The team utilized a comprehensive set of software tools and libraries for the implementation and execution of computer vision and deep learning algorithms. Python, version 3.8.10, was the primary programming language due to its extensive support for machine learning and image processing.
- OpenCV (version 4.8.1.78): Employed for image capturing, transformation, feature detection, and calibration procedures.
- TensorFlow (version 2.10.0): Used for constructing and training neural network models, managing GPU resources, and configuring memory growth.
- YOLOv4: Integrated via the yolov4 Python package for object detection tasks.
- NumPy: Extensively used for array manipulation, mathematical operations, and supporting image data handling.
- Additional Python Libraries and Modules: Including math, time, argparse, pickle, random, os, and os.path for various functionalities.
- CUDA (version 10.1): Used for accelerated neural network computation on NVIDIA GPUs.
- CUDNN (version 7.6.4): Provided GPU-accelerated primitives for deep neural networks.
- PyTorch (version 2.1.1): Potentially used in certain parts of the project, possibly for model implementations.
- Custom Modules: Such as dartHandler and loss, for project-specific tasks and functions.
- Camera and Image Data Handling: Managed via OpenCV’s video capture capabilities for network cameras and video files.
- Deep Learning Model and Training: The YOLOv4 model was built and trained with custom configurations for specific project requirements, including background subtraction and morphological operations for object detection enhancement.
Dataset
In the development of an enhanced automatic dart scoring system, the team capitalized on the existing DeepDarts dataset, further augmenting it to adapt to a broader range of camera angles and views.
The original DeepDarts dataset is a comprehensive collection of images used for training an automatic scorekeeping solution for steel-tip darts and formed the basis of this project. Comprising 16,000 images from two distinct dartboard setups, it provided a robust foundation for initial model training. The primary dataset included 15,000 images captured from a face-on view using a smartphone, where the DeepDarts system demonstrated a remarkable accuracy of 94.7% in total score prediction.
To extend the applicability of the model to images captured from non-standard angles, specifically projected views causing distortion, an additional 2,200 images were integrated into the dataset. These images were collected to represent the variations and distortions encountered in a projected camera setup, a scenario not covered in the original dataset.
Training for an additional 50 epochs on this augmented dataset, the team aimed to retrain and bias the model towards this new perspective. This approach was designed to maintain the efficacy of the DeepDarts model while removing the constraints of specific camera placement.
The retrained model, incorporating both head-on and projected view images, promises a more versatile application, potentially suitable for deployment on edge devices. This versatility enhances the accessibility of the system, allowing for automatic dart scoring with varying camera placements.
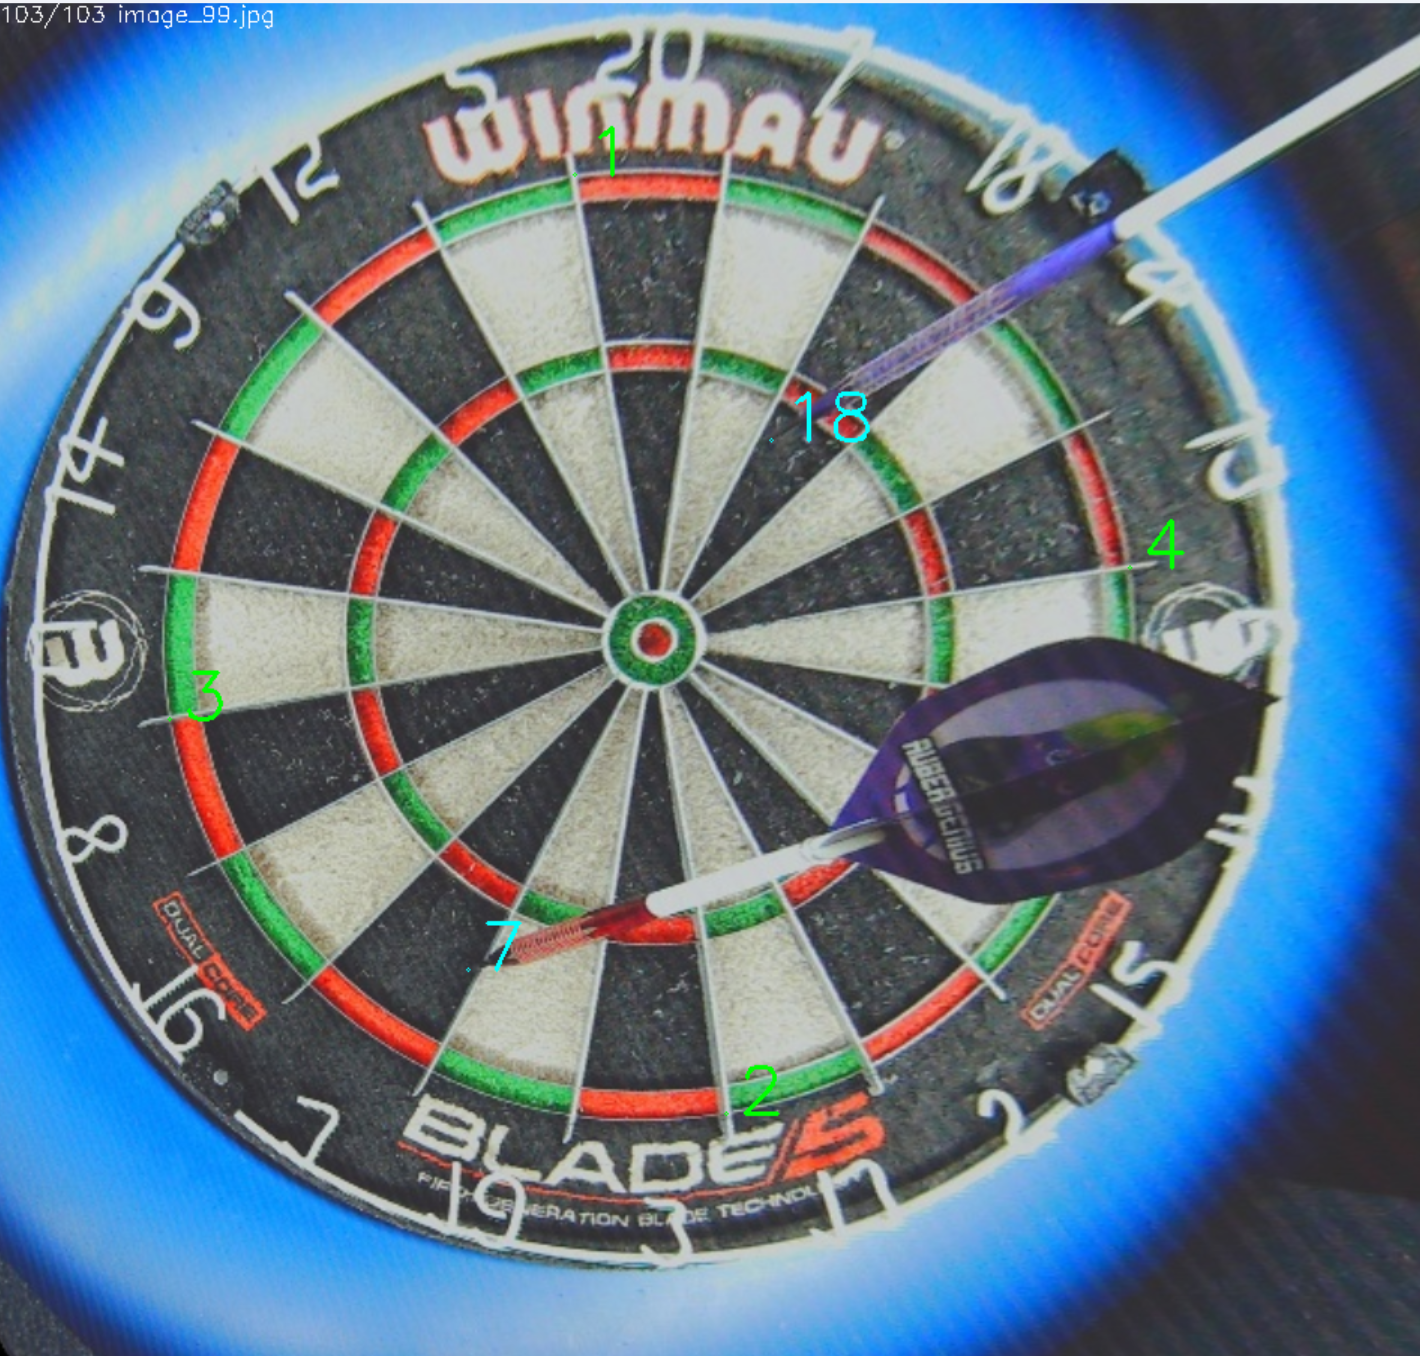
To train the DeepDarts model further, the expanded dataset needs to be annotated. The creators of DeepDarts created an annotation script that allowed for quick annotation of all the images, an example of image annotation can be seen in the following figure:
Lens Correction
The dart scoring system employs the "ELP 170 Degree Wide Angle Fisheye Web Camera 5.0 Megapixel Aptina MI5100 CMOS Sensor Mini USB External Camera". Due to its wide-angle lens, this camera introduces significant fisheye distortion, a common issue in wide-angle lenses that results in a spherical, distorted image. To correct this distortion and ensure precise dart location identification, a meticulous calibration process was implemented using OpenCV, a library widely adopted for computer vision tasks.
Calibration Process:
- Chessboard Utilization: A standard calibration technique involving a chessboard pattern was employed. The well-defined corners of the chessboard serve as a reliable reference for mapping lens distortion.
- Corner Detection: OpenCV’s findChessboardCorners function was used to detect the corners of the chessboard in the distorted image, identifying the locations of internal corner points in the chessboard pattern.
- Refining Corner Accuracy: The cornerSubPix function refined the coordinates of the detected corners to sub-pixel accuracy, enhancing the precision of the calibration.
- Lens Distortion Parameters: The calibration process yielded the camera matrix K and distortion coefficients D, crucial for rectifying the fisheye distortion.
The obtained camera matrix K and distortion coefficients D were as follows:
Camera Matrix K:
[1125.6429279 0.0 1270.7578466]
[0.0 1125.4455043 910.5792634]
[0.0 0.0 1.0]

Distortion Coefficients D:
[-0.00746943]
[-0.0055724]
[-0.00386353]
[0.00116922]
Distortion Correction: With these parameters, the fisheye distortion in the camera’s images was corrected, essential for accurate dart detection. Some residual distortion remained in the top right corner of the corrected images. However, this did not significantly impact the dartboard area due to the camera’s positioning and angle. The correction marked a substantial improvement, ensuring the system’s accuracy.
Through this process, the fisheye distortion inherent in the wide-angle camera was successfully mitigated, enabling precise and reliable dart detection and scoring in the PEELA system without lens artifacts.
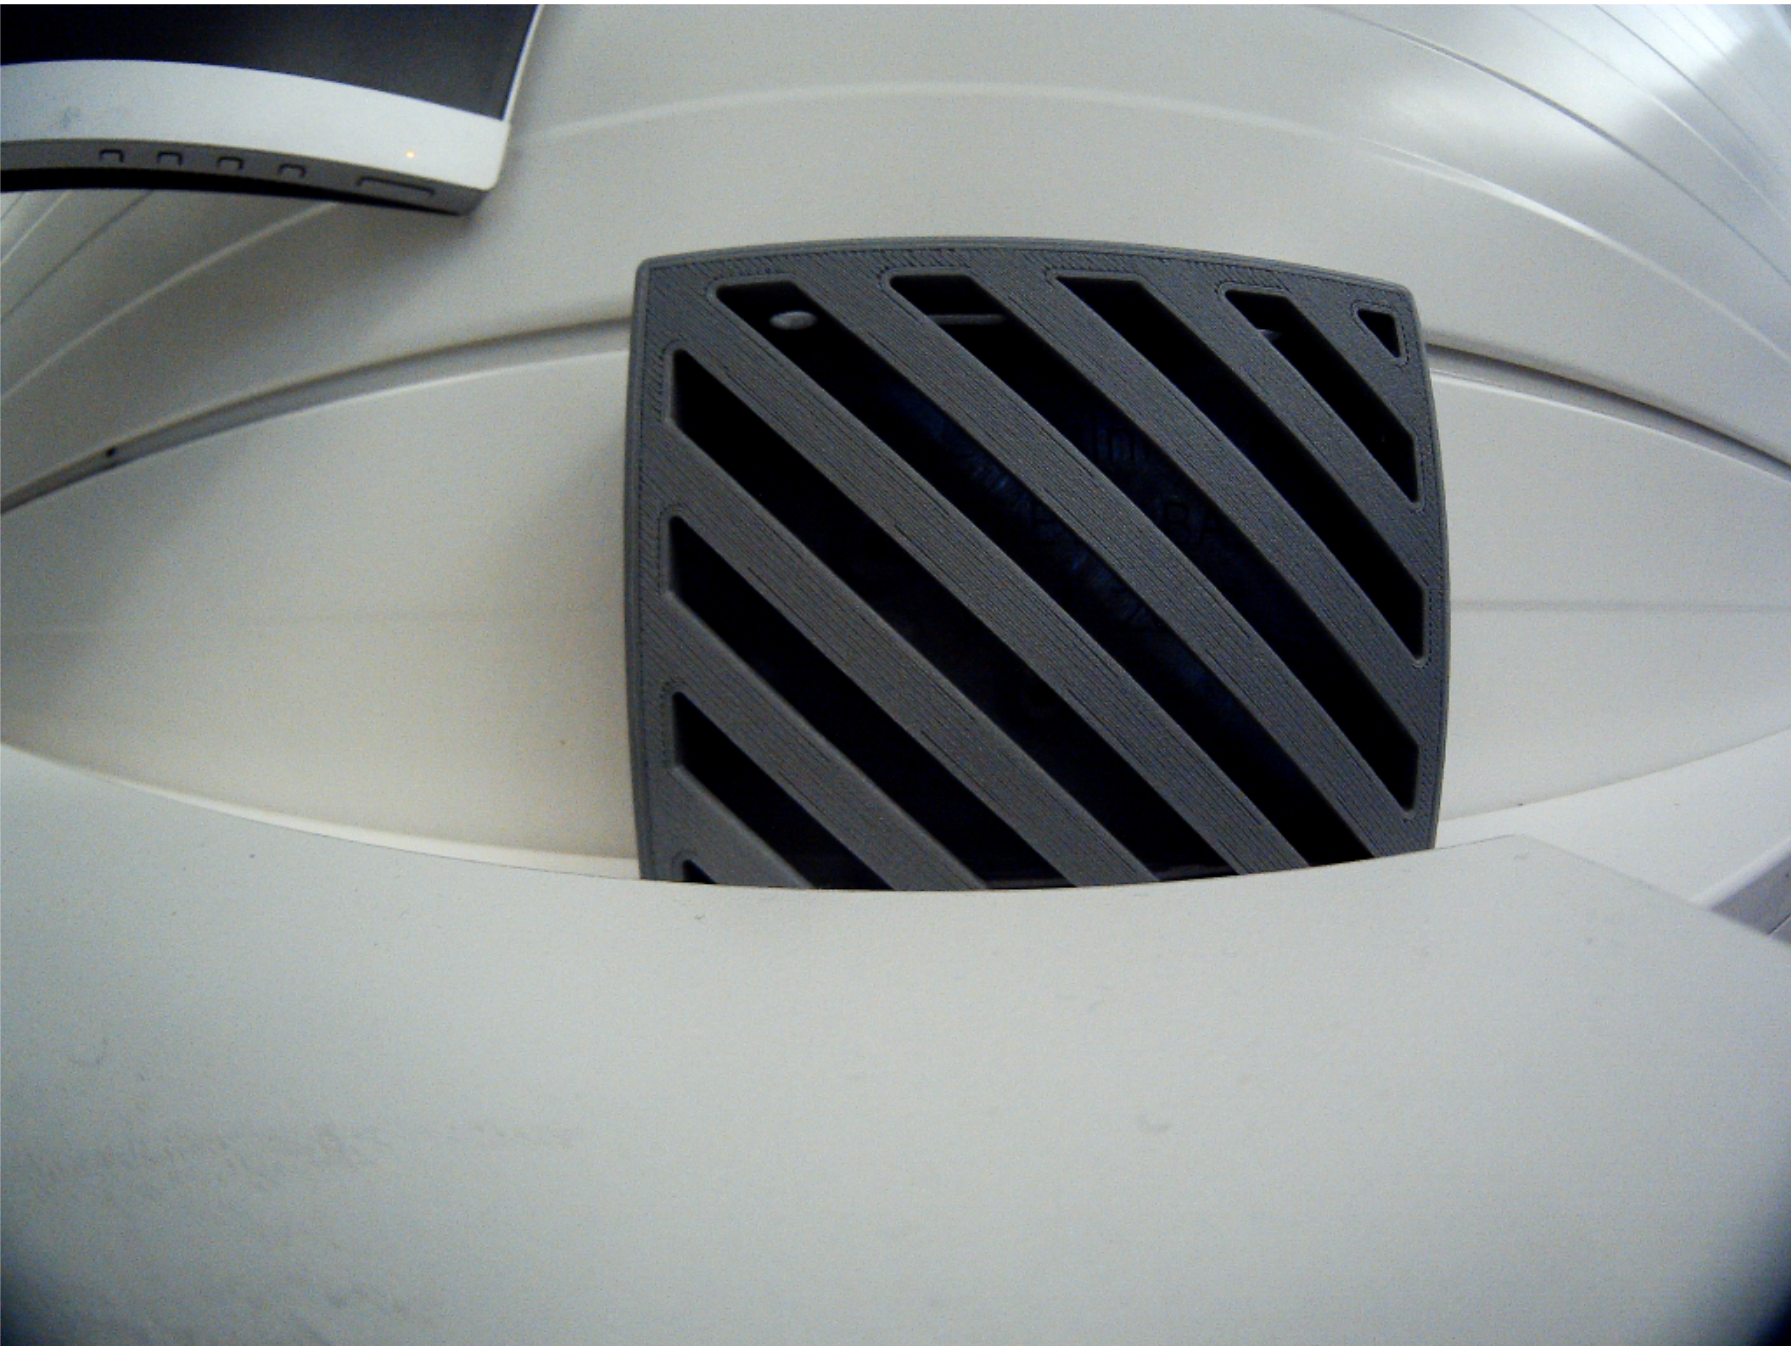
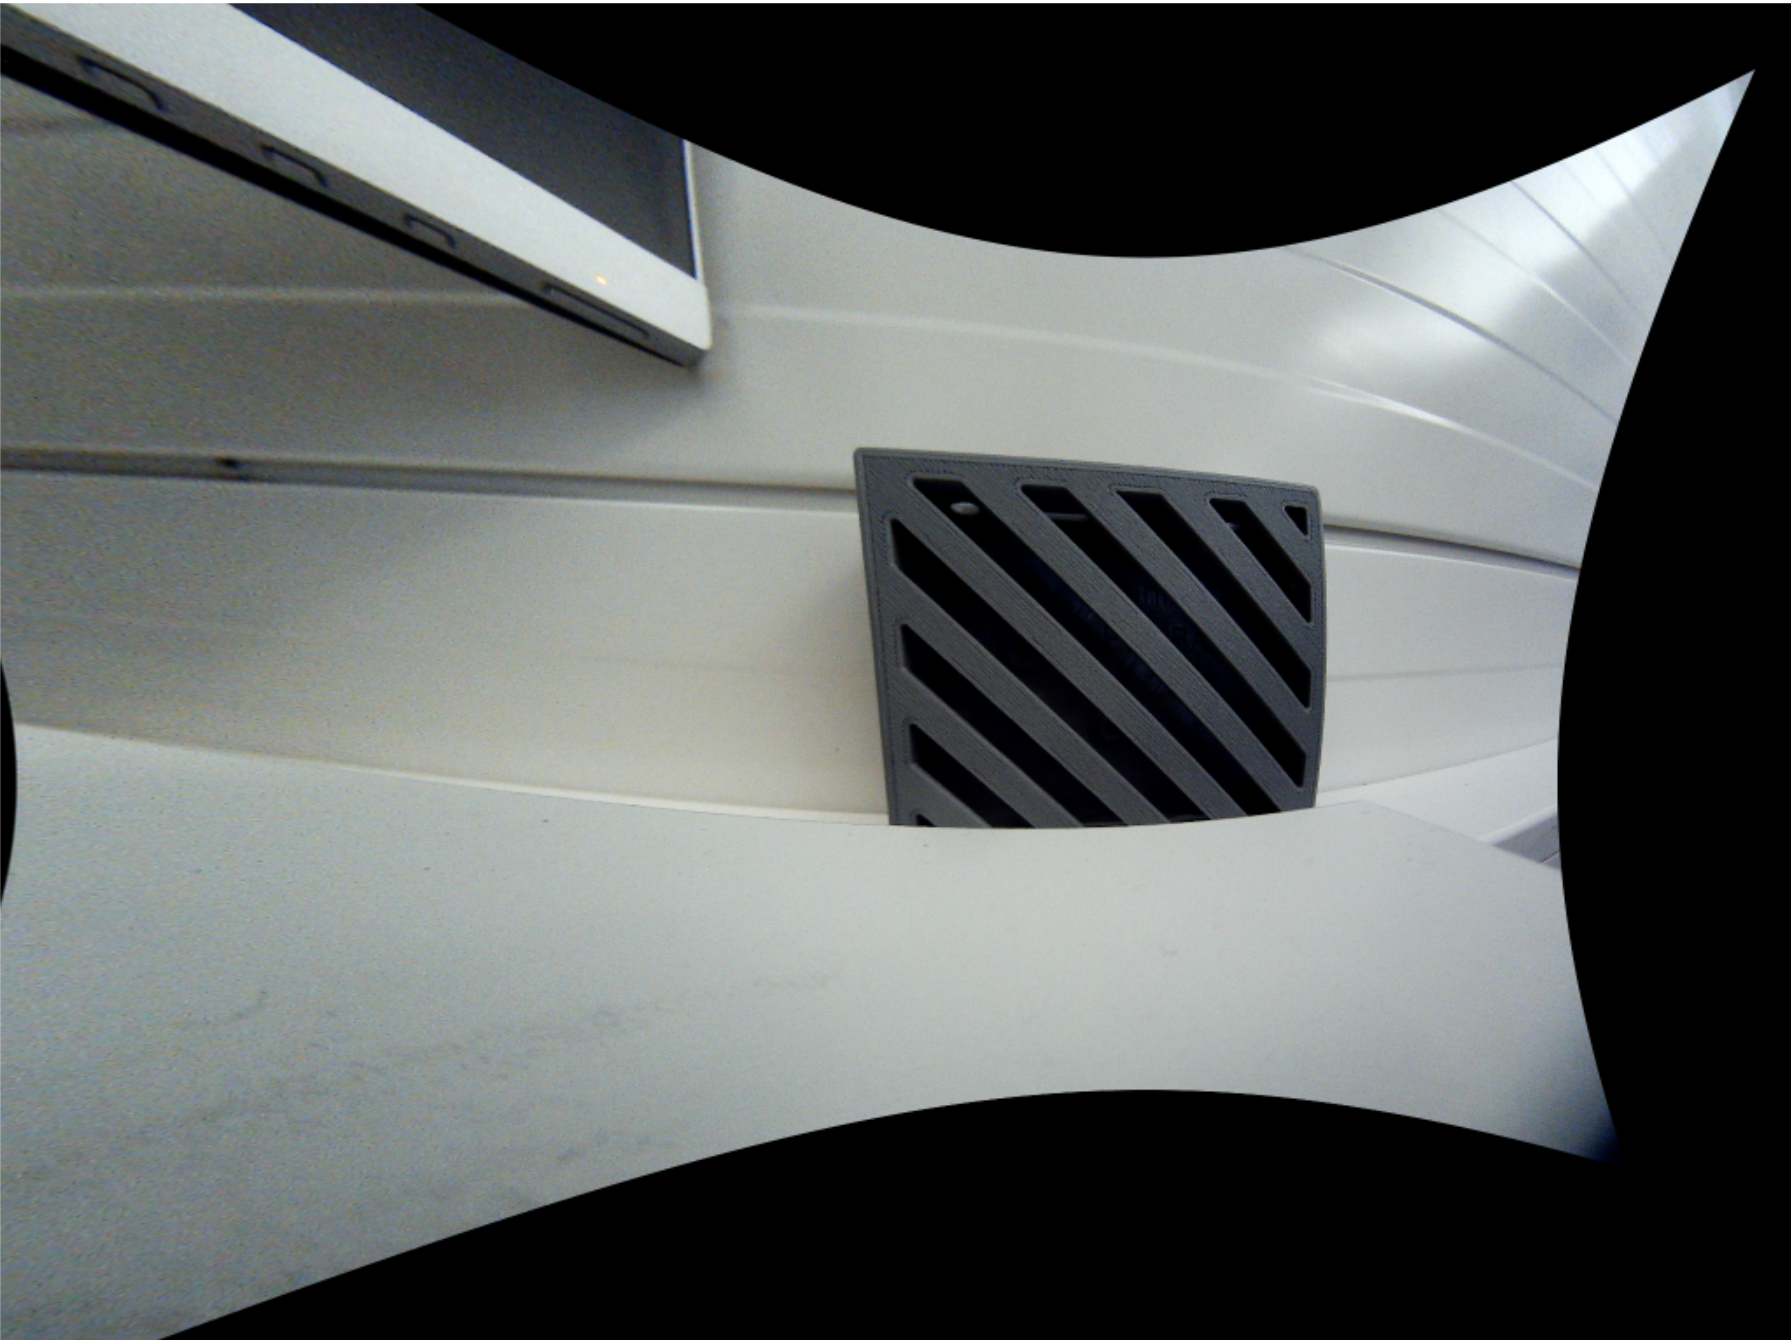
Image Transformation
For the dart detection model to perform successfully, it’s crucial that the dataset includes images that mirror the perspective of the original dataset. This replication of the original training images facilitates faster convergence of the model, as it becomes more adept at recognizing patterns and features consistent with its training.
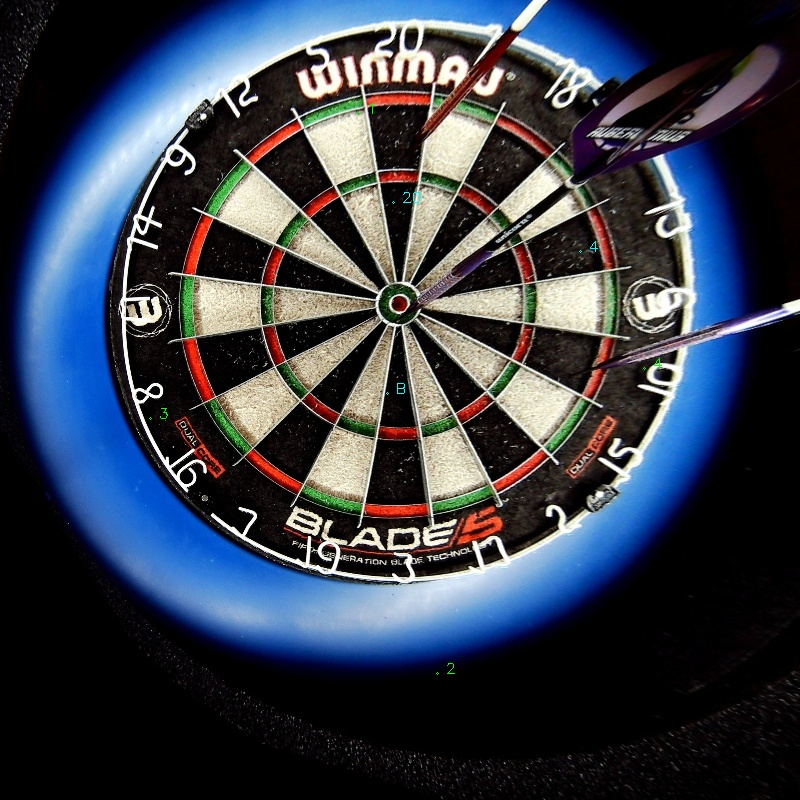
A key aspect of this process involves the camera view. Unlike the original dataset, where the camera perspective might be direct and head-on, the new images could be captured from different angles. To address this, the first step is to identify the boundaries of the dartboard in each image, which can be seen in the following figure:
Once these boundaries are detected, a transformation process is employed using SIFT (Scale-Invariant Feature Transform).
SIFT plays a pivotal role in adapting the images. It allows the model to map and align features from the angled view of the dartboard to a reference photo taken from a direct, head-on perspective. This feature matching is essential for achieving a high-quality transformation of the image. The end result is an image that, despite originally being captured at an angle, is transformed to appear as if it was taken from a head-on view. This transformation is vital for the model to accurately detect and analyze the darts in a manner consistent with its original training, thereby ensuring effective and reliable dart detection.
Prediction Merging
The merge_predictions function takes in predictions from two cameras, along with their respective angles and distances for each detected dart. It then compares these measurements to identify any overlapping detections between the two cameras. This is crucial to avoid double-counting a dart that both cameras have detected.
The function uses predefined angle and distance thresholds to determine whether detections from both cameras represent the same dart. Adjustments to the angle threshold are made based on the proximity of the dart to the bullseye, since in the center, just a few pixels can be over 10 degrees.
Once the merging process is complete, the function outputs a refined set of detections that more accurately represent the darts thrown. This refined set is then used to calculate the scores.
After merging points, the scores are calculated based on the merged dart positions. It keeps track of the scores in each round, ensuring that the score of each throw is correctly identified and processed.
The code handles various scenarios, such as the beginning of a new round, the second or third throw in a round, or instances where no score is detected. In each case, it performs appropriate actions like resetting scores for a new round or sending out the calculated score for a throw.
The code ensures that each score is only sent once to the frontend and that the scores are sent in the correct sequence corresponding to the throws.
The system also accounts for situations where no score is detected for a series of consecutive attempts, indicating the possible start of a new round.
This logic can be improved further as it currently can’t handle detection "flicker" very well when the model either detects the same point twice when it is outside the threshold, or when it detects nothing. These cases need to be accounted for better robustness.
Training
The experimentation involved training sessions on varying sizes, culminating in a dataset encompassing as many as 2200 images. This diverse dataset was essential for enhancing the model’s performance and adaptability. We employed distinct subsets of the dataset for different training modules, specifically utilizing 926, 1334, and 2052 images. These variations were crucial in assessing the model’s robustness and adaptability to different volumes of data.
The approach adopted for training was a strategic one. We began with the weights of the original DeepDarts model. These weights served as the starting point for our modifications. By fine-tuning the pre-existing weights of the DeepDarts model with our new dataset, we could tailor the model more precisely to our specific requirements. This method was particularly effective in optimizing the model’s performance for the specific angles and perspectives characteristic of the camera outputs used in our setup.
This targeted training approach significantly enhanced the model’s capability to detect darts on the board. The fine-tuning process introduced a favorable bias towards the unique viewpoints provided by our camera setup, thereby elevating the overall accuracy of the model. The results from these varied training sessions provided valuable insights into the scalability and effectiveness of the model across different dataset sizes, demonstrating its potential for broader application in similar tasks.
During the training of all models, there was a significant decrease in training loss, indicating an improvement in the models’ ability to predict accurately. An interesting observation is the comparison between training durations of 40 epochs and 60 epochs. While both durations led to a decline in training loss, the difference in outcomes, although subtle, is noticeable. This distinction can be clearly observed in the following training loss graph:
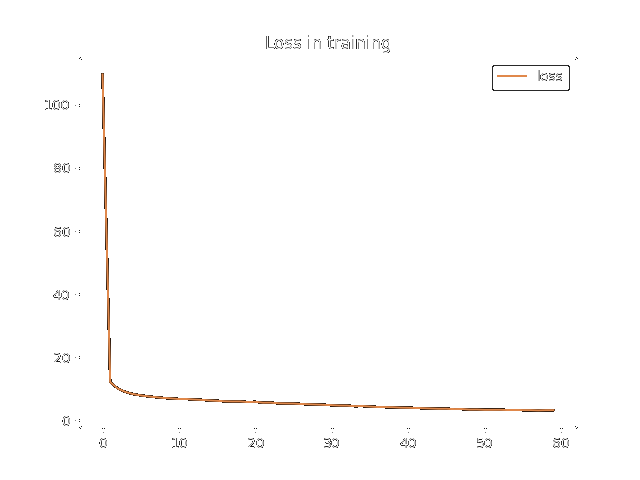
This slight but discernible difference suggests that while longer training does lead to incremental improvements, there is a point of diminishing returns. This is a critical consideration in machine learning, as it involves balancing the benefits of extended training against the time and resources required. It underscores the importance of finding an optimal training duration that maximizes performance gains while maintaining efficiency.
Results
The results from running predictions on validation data are shown in the table below:
| Model | Images | Position Accuracy [%] | Precision [%] | Recall [%] | PCS Accuracy [%] | Epochs |
|---|---|---|---|---|---|---|
| 1 | 726 | 60 | 85.9 | 55.4 | 33.8 | 60 |
| 2 | 726 | 74 | 95.7 | 68.9 | 70 | 40 |
| 3 | 1134 | 73 | 93 | 72 | 72 | 40 |
| 4 | 1752 | 85.8 | 98.9 | 81.95 | 88.7 | 60 |
First Model
The images were subjected to various kinds of augmentations, including warping and rotating the images.
Second Model
The augmentations were removed in the second model. This resulted in a better generalization of the dataset’s real-world changes. Since the pre-processing of the images described already transforms and rotates the image to the correct orientation, these augmentations are not needed during training. This resulted in an increase of PCS from 33.8% to 70%.
Third Model
For the third model, the training data was increased. By introducing more data to test and validate on, the accuracy went down a bit, but was still in a similar range as before.
Fourth Model
For the fourth and final model, some more changes were introduced. The original images were matched by slightly changing their contrast, brightness, and saturation, to match the proposed settings of the camera. The dataset was also increased from 1134 images to 1752 images. Training this model for 60 epochs resulted in the highest accuracy of 88.7%.
Combined Outputs from Both Cameras
This data is not the final output of the prediction since two cameras are utilized in the final prediction. When the results from the two cameras are combined, the results are significantly better. Using both cameras enables the algorithm to better determine dart location, and see otherwise "hidden" darts that were obscured in the other camera’s view. Real-world testing analyzing 100 dart throws resulted in a score precision of 0.98 and a score recall of 0.92. These results show that this method could be fine-tuned for a better method to use for dart detection.
Discussion
The customized version of the model, despite its advancements, did not quite match the training PCS (Percent Correct Score) accuracy achieved by the original model. The peak accuracy attained by our adapted model was 88%, which falls short of the impressive 94.8% benchmark set by the original. However, it’s important to note that our model demonstrated considerable improvement and achieved remarkable results as the dataset was expanded. In its final form, the custom model recorded an 88.7% PCS, alongside a notably high precision rate of 98.8% and a recall rate of 81.95%.
Comparatively, the original DeepDarts model did not emphasize metrics such as recall and precision. Its primary focus was on the Percent Correct Score, which served as a combination of precision and recall as well as being the central measure of its performance. This difference in metric prioritization means that a direct comparison of recall and precision rates between the two models is not feasible. Nonetheless, the new metrics introduced in our custom model provide a broader perspective on its performance, offering insights into its precision and ability to correctly identify relevant data points, which are crucial aspects in evaluating the overall effectiveness of such models.
The observation that expanding the dataset by 500 images did not significantly enhance the performance of the third model can be attributed to a concurrent increase in the size of the validation set. This is a key factor in understanding the model’s performance metrics. While the training dataset was augmented, the validation set was proportionally enlarged as well.
In contrast, the earlier models were validated against considerably smaller datasets. Validating on a smaller scale can sometimes lead to an overestimation of a model’s performance, as it faces a narrower and potentially less challenging range of data. Therefore, the third model’s expanded validation set, by encompassing a broader spectrum of data, provided a more rigorous and comprehensive testing environment.
This more extensive validation process is likely to have tempered any observable performance gains from the increased training data. It highlights the importance of the validation set size in assessing a model’s true effectiveness and underscores the need to consider both training and validation datasets’ sizes when evaluating machine learning model improvements.
Conclusion and Future Work
The method underwent a live demonstration during its presentation and proved to be somewhat robust since the live demonstration resulted in perfect operation. The model was also tested in a full game of 501, and it performed admirably well. The real-world applicability of the model is promising, as it would require only minimal corrections - perhaps once or twice - in a complete game of 501. Given that this project was developed within a mere two-week timeframe, such a level of accuracy and efficiency is indeed commendable and can be regarded as a significant achievement.
However, there is room for further enhancement. For instance, the score comparison logic that currently relies on two cameras could benefit from additional refinement. Integrating a third camera might provide a more decisive and accurate comparison of scores, thereby increasing the system’s robustness. This additional camera angle could offer a tie-breaker perspective in cases where the first two cameras provide conflicting data, enhancing the overall reliability of the system.
Another aspect requiring attention is the user interface, particularly its integration with the model. The current user interface, derived from the ‘darts-go’ project, which has been inactive for five years, presents certain challenges. This legacy system harbors unresolved issues that need addressing to ensure a seamless and robust integration with our model. Addressing these issues will not only improve the user experience but also enhance the system’s overall functionality and reliability, making it more suitable for widespread use.
--
Sindri Thor
Friðrik Tryggvi Róbertsson
Ólafur Starri Pálsson